
Niger J Paed 2014; 41 (4): 307– 3 11
ORIGINAL
Eke CB
Comparison of actual (measured)
Ubesie AC
Ibe BC
weights and heights with the
standard formula methods of
estimation among children in
Enugu
DOI:http://dx.doi.org/10.4314/njp.v41i4,3
Accepted: 13th April 2014
Abstract
Background: In
paediat-
age. The level of significance was
ric practice, weight and height are
set at p<0.05.
Eke
CB
(
)
required for therapeutic and diag-
Results: A
total of
370 children
Ubesie AC, Ibe BC
nostic interventions. In some cir-
Department of Paediatrics, University
were studied. They were aged one
of
Nigeria Teaching Hospital
cumstances actual anthropometric
year two months to 12years.
Ituku- Ozalla, Enugu
measurements are not possible and
Among children ≤ 2 years the
Email: chriseke2006@yahoo.com
estimates are used. Several formu-
measured weights and estimated
lae are in use for weight and height
values showed no significant dif-
estimations. The adequacy of these
ference. However, in children
estimates has not been tested for
3-5years, the estimated weights
our children. The aim of the cur-
were significantly lower than the
rent study was to compare the ade-
measured weights. There was no
quacy of formula methods of
consistent relationship for children
weight and height estimation with
7–12 years where a different for-
measured
values in children.
mula was used to estimate weight.
Materials and Methods: This
was a
For heights, the estimated values
comparative observational study.
were significantly lower than the
Children who met the inclusion
measured except for two year olds
criteria were selected consecutively
where both where almost similar.
and studied over a two month pe-
Scatter diagrams comparing actual
riod using a semi-structured ques-
and estimated plots showed linear
tionnaire. Weight and height of
relationship.
each child were measured and re-
Conclusion: The
current methods
corded to the nearest 0.1kg and
of
estimation are underestimating
0.1cm respectively using standard
weights and heights of children in
protocols. Weight and height for
our environment. There is need for
age were also estimated using the
a
multi-centre cohort study to test
universally
accepted
formulae.
the various formulae in our
Data were analyzed using SPSS
children.
19.0. Paired
t-
test was used to compare the
Key words: Measured,
Estimated,
means of actual and estimated
Weight, Height, Children.
weights and heights according to
Introduction
height as the case may be. This “gold standard” should
be
obtained in all cases when feasible .
2
In
the management of very ill children, anthropometric
However, in our setting and even in elsewhere, it has
data especially weight and/or height are required for
been shown that in paediatric emergency situations re-
therapeutic interventions. Weight and/or height are im-
quiring resuscitation; this is not often done, as all efforts
portant in calculating drug dosages and/or fluid admini-
are geared to save time and apply adequate therapeutic
stration and selecting correct equipment sizes . In some
1
interventions timely.
circumstances actual measurements of weight or height
In
such situations it is often more time saving to use
may not be feasible and estimates are used.
estimated formula in calculating height or weight.
The most accurate method of determining a child’s
Commonly in our setting the age based formulae for
weight or height is to weigh the child or measure the
weight estimation is usually applied as follows: for

308
children aged 1 -6 years: 2n +8; for children 7-12years:
Measurements were taken twice and the average re-
7n- 5/2; while for height estimation in children aged 2 –
corded
in the spaces provided in the proforma.
12
years, the formulae: 6n + 77 (where n = age in years)
The weights of the enrollees were estimated using the
3
is
applied. The adequacy of these estimates has not
following formulae:
been tested for our children. Hence, the aim of this
For children aged 1-6 years, the formula:
2n +
8
(where n = age in years) was applied.
3
study was to compare the predictive accuracy of actual
(measured) with formula estimates of weight and height
For instance a child aged one year six months, the esti-
in
children.
mated weight using the above formula was determined
thus: 2 (1.5)+ 8 = 11.0kg and so on.
Also children aged seven years to twelve years, the for-
mula: 7n-5, all divided by 2 (where n = age in years)
Materials and methods
was
used.
3
This
was a comparative observational study conducted
For height estimation: the
formula: 6n
+ 77
(where n
=
among children aged one year to 12 years attending the
age in years) as recommended for children aged 2-12
years of age) was applied. The estimated height for chil-
3
children’s outpatient clinics (CHOP) of University of
dren aged one year was taken as 75cm.
3
Nigeria Teaching Hospital, (UNTH) Enugu State South
East Nigeria.
The children’s outpatient clinics of the Department of
Data Analysis
Paediatrics UNTH, Enugu renders primary, secondary as
well as tertiary healthcare services to the teeming popu-
Data were analyzed using SPSS 19.0. Paired t- test was
lation of minors in Enugu State and its environs among
used to compare the means of actual and estimated
other services. It runs general paediatric outpatient clin-
weights and heights according to age. Scatter diagram
ics from Monday through Friday with average daily pa-
was plotted to determine the relationship between actual
tient load of 60-80 children. Data was collected by one
and estimated heights; actual and estimated weight
of
the researchers. Ethical approval was sought from the
based on weight formula for children aged 1-6years and
Ethics and Research Committee of UNTH, Enugu.
7
– 12years. The level of significance was set at p <
0.05.
Data collected included age, date of birth, gender, edu-
cational backgrounds and occupation of the parents/
caregivers from where child’s socio-economic class was
Results
assigned using the method proposed by Oyedeji in
4
Ilesha, Nigeria. The respective age of all the subjects
A
total of 370 children were studied. They were aged
were confirmed through their date of births.
one year two months to twelve years (mean age 6.0 ±
Subjects
were excluded if they had any medical condi-
3.7
years). Two hundred and twenty five (60.8%) were
tion that would substantially affect their weight and/or
males while 145 (39.2%) were females. One
hundred
height – amputation, or dwarfism, congenital heart dis-
and
sixteen (31.4%) and 168 (45.4%) children were
eases, dehydration, volume overload, or oedema, severe
from the middle and lower socio-economic classes re-
joint contracture or neurologic deficits e.g. cerebral
spectively. The socio-demographic characteristics of the
palsy that can affect growth. Children who their caregiv-
children are shown in Table 1.
ers gave informed consent and met the study criteria
were recruited using convenient (consecutive) sampling
Table 1: Socio-demographic
characteristics of
the
method from 1 June to 31 July, 2013.
st
st
subjects
Variables
Frequency (%) (N = 370)
The weight was recorded with a Tanita HD-314 portable
bathroom scale and has a maximum recordable weight
Gender:
of
110kg.At the beginning of each measurement day,
Males
225
(60.8)
accuracy of the weighting scales is checked by using a
Females
145
(39.2)
known standardized weight placed on the scale.
Socio-economic class:
Upper
86
(23.2)
Before, each measurement, the scale is usually turned to
Middle
116
(31.4)
‘zero”
to correct for zero error. The children were meas-
Lower
168
(45.4)
ured wearing only a single layer of light / outdoor cloth-
ing. Weights were measured in kilograms to the nearest
Table 2 shows the measured weight (mean ± SD) and
100grams.
estimated weight (mean ± SD) by age. Here for children
two years and or below, the measured weight and esti-
The standing height was measured (for selected children
mated showed no significant difference. However, in
2years and older) using a stadiometer. With the child
children 3-5years, the estimated weights were signifi-
standing upright, the head was positioned in the Frank-
cantly lower than the measured weights. There was no
furt horizontal plane, and the headboard placed carefully
consistent relationship for children 7 – 12 years where a
but firmly on his head. The child was asked to take a
different formula was used to estimate weight. In chil-
deep breath while the reading was made. The height
5
dren7-8years the estimated weights were significantly
measurements were read off to the nearest 0.1cm.
lower than the actual values while in those aged
309
9
-11years estimated values showed no significant dif-
significant (p<0.001).
ference. Also in the 12year olds the estimated weights
Kruskal Wallis test, did not show significant difference
were significantly lower than the measured values.
between the various socio-
For heights, the values were significantly lower than the
economic classes and either the difference of estimated
measured except for two year olds where both where
weight from actual weight (p=0.229)
almost similar.
or
the difference of estimated height from actual height
A
comparison of the mean actual and estimated weights
(p=0.15). The mean bias was 1.15kg for the weight for
and heights according to age is shown in Tables 2 and 3
age formula (95% CI -0.71 to-1.59) and -5.19 for the
respectively.
height for age formula (95% CI -4.55 to -5.83).
A
negative mean bias is noted in both formulae for
Table 2: A
comparison of
the mean
actual and
estimated
weight and height estimation.
weight by age
There was no statistically significant difference between
Mean weight (kg)
males and females; and the difference of estimated
Age
(years)
Actual (SD)
Estimated (SD)
p-value
weight from actual weight (p=0.625). The difference
between mean measured height among females (120.2 ±
1.
10.3±1.3
10.0±0.0
0.340
25.6 cm) and males (114.6 ± 25.8 cm ) was statistically
2.
12.3±1.6
12.0±0.0
0.260
significant (p=0.04).
3.
15±1.8
14.0±0.0
0.001
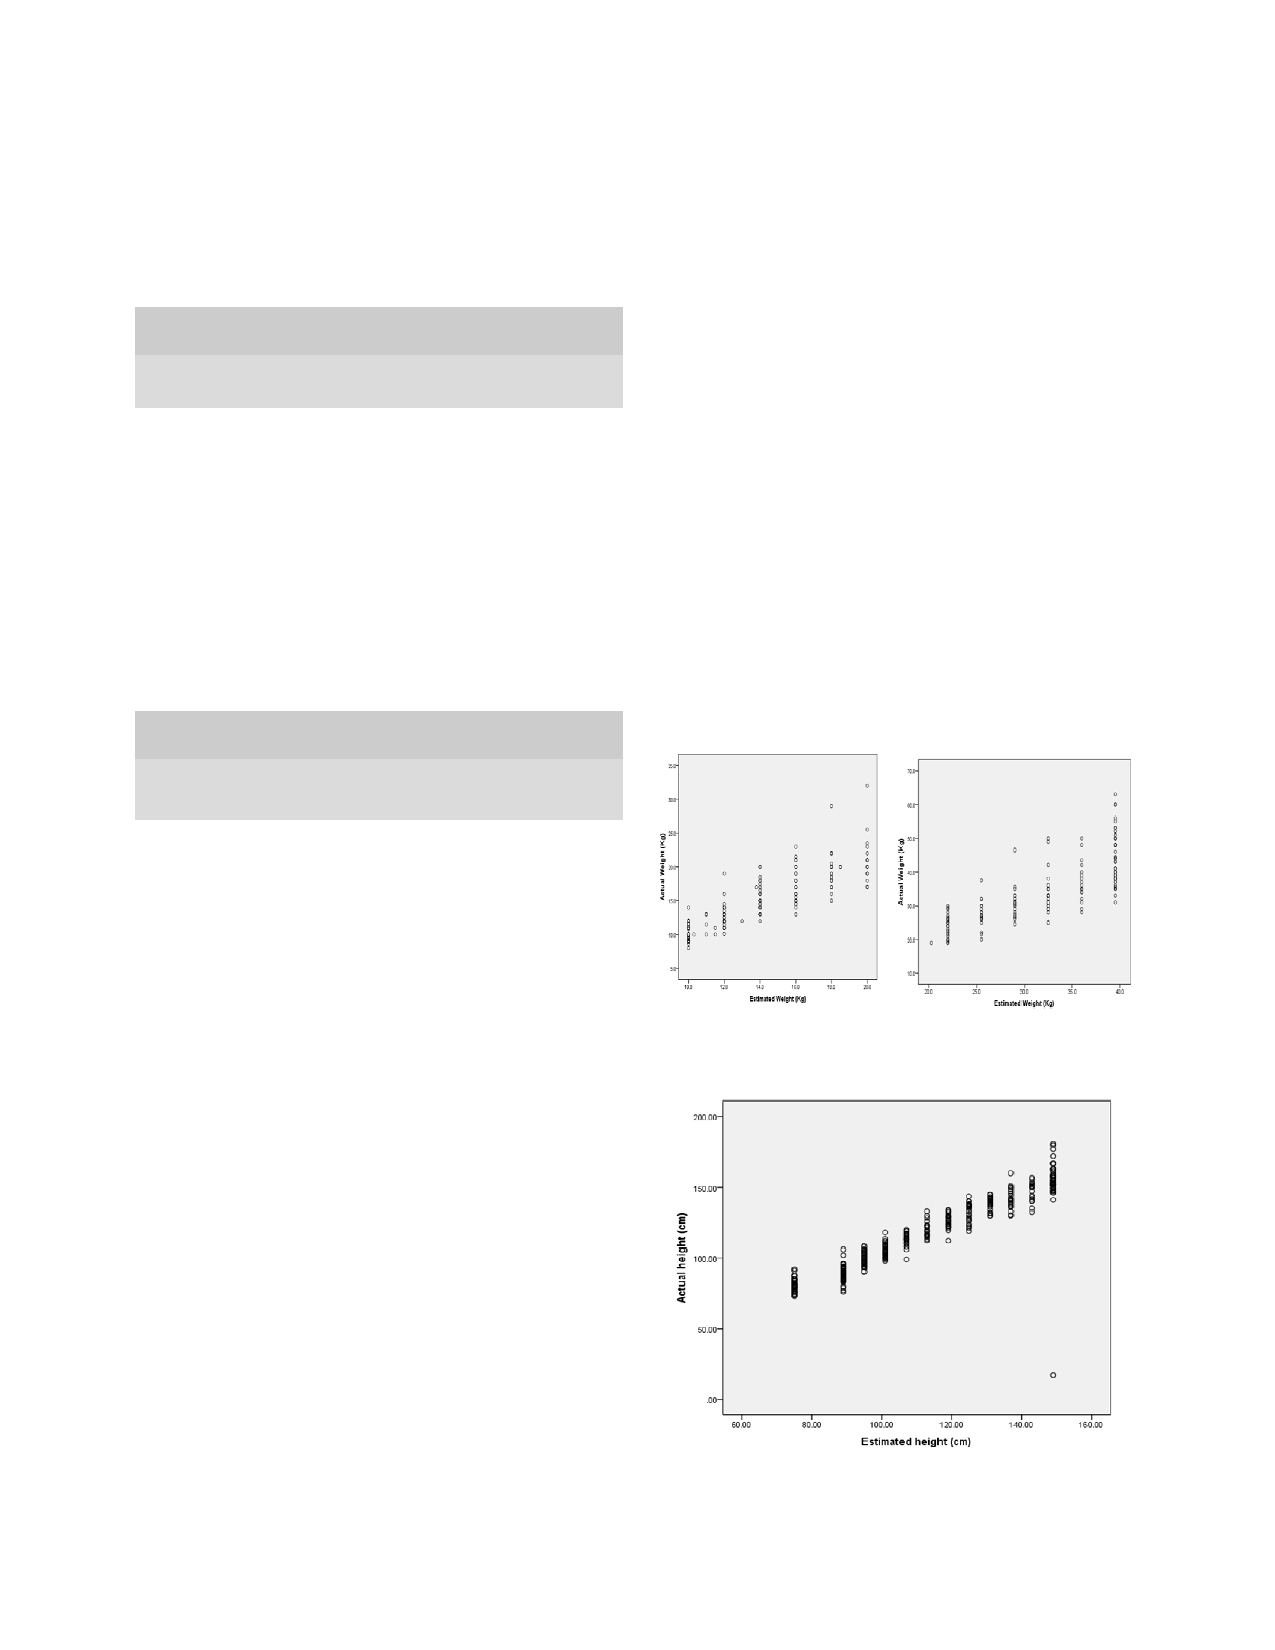
Scatter diagrams comparing actual and estimated
4.
17.2±2.4
16.0±0.0
0.005
5.
19.2±2.7
18.0±0.0
0.030
weights and heights are shown in Figures 1
6.
21.2±3.2
20.0±0.0
0.120
and 2 respectively. The plots showed linear relationship
7.
23.7±3.4
22.0±0.0
0.010
between actual and estimated values. However, there
8.
27.4±3.5
25.5±0.0
0.009
appears to be more positive linear relationship for
9.
30.5±4.6
29.0±0.0
0.140
weights among children
10.
34.0±6.3
32.5±0.0
0.270
aged 7-12 years than those aged 1- 6 years (Fig 1).
11.
37.0±5.9
36.0±0.0
0.480
12.
44.0±7.9
39.5±0.0
0.001
Fig 1: Scatter
diagrams showing
the relationship
between ac-
tual and estimated weights for children aged 1-6 years (left)
Table 3: A
comparison of
the mean
actual and
estimated
and
7-12 years (right).
heights by age
Mean heights (kg)
Age
(years)
Actual (SD)
Estimated (SD)
p-value
1.
80.4±4.6
75.0±0.0
<0.001
2.
88.3±5.2
89.0±0.0
<0.340
3.
99.2±4.8
95.0±0.0
<0.001
4.
105.4±4.3
101.0±0.0
<0.001
5.
112.9±4.6
107.0±0.0
<0.001
6.
120.9±5.6
113.0±0.0
<0.001
7.
125.8±5.3
119.0±0.0
<0.001
8.
132.4±6.6
125.0±0.0
<0.001
9.
138.5±4.6
131.0±0.0
<0.001
10.
141.9±7.4
137.0±0.0
0.007
Fig 2: A
scatter diagram
showing the
relationship between
11.
147.3±7.0
143.0±0.0
0.020
actual and estimated heights.
12.
153.8±22.8
149.0±0.0
0.017
The overall median measured and estimated weights
were 20kg (range 8-63kg) and 18kg (range 10-43kg) and
the difference was statistically significant (p = <0.01)
while median measured and estimated heights were
114.8cm (range 73-177cm) and 107cm (75-149cm) re-
spectively and the difference was statistically signifi-
cant (p = <0.01).
Pearson’s product moment correlation showed a very
strong correlation between actual and formula estimated
weight with an r – value of 0.934 (p = < 0.01) and height
with an r – value of 0.930 (p = <0.01) respectively.
The overall mean measured and estimated weights were
23.2 ± 11.5kg and 21.7 ± 9.8kg respectively. There was
a
statistically significant difference between the mean
actual and estimated weights (p<0.001). The overall
mean measured and estimated heights were 118.8 ± 25.9
cm
and 112. 1 ± 23.1cmrespectively. The difference in
mean of actual and estimated heights was statistically

310
Discussion
were
proposed many years ago. The growth pattern of
children may have changed with better nutrition. Weight
Knowledge of weight and/or height is an invaluable tool
and
height increments occur earlier. This is very obvious
in
paediatric practice. The assumption is that the formu-
in
height as observed in the current study.
Martorell et al
15
lae for weight and height estimation will give a value
documented that obesity levels in-
not significantly different from actual weight and height.
creased overtime but at varying rates, and concluded that
This study shows that both methods of weight estima-
rising incomes in developing countries and increased
tion gave values that were significantly lower than the
‘westernization’
will most likely lead to increased levels
actual values with some outliers in certain cases. Simi-
of
obesity in developing nations. The overall implication
larly, the estimated heights were significantly lower than
is
that they accumulate a lot of weight and excess fat
the measured except for the two year olds where they
mass deposits.
were comparable.
It
has been shown in a previous study that certain weight
In
the paediatric emergency situations, fast and accurate
formula like the new Advanced Paediatric Life Support
methods of weight and height estimation are needed for
(APLS) formula published in 2011 under – estimated
immediate therapeutic interventions in order to save
weight with the under – estimation increasing in chil-
lives.
Many estimation methods currently exist but most
dren aged one to five years . Similarly other methods of
6
may now be overtaken by time as many developing
weight estimation including the Broselow tape and the
countries including Nigeria are grappling with “double
age formulae have also been shown to under- estimate
burden” of malnutrition with obesity/overweight being
weights in studies done in Switzerland and Australia
on
the increase resulting in the fact that the formula esti-
respectively .
1,7
mation of weight or height may be under- estimating the
actual value in many of the children.
It
has being reported that visual , parental estimation
8
9
and
estimation by attending nurses and doctors
11
are
often inaccurate and potentially unreliable.
Previous investigations of the accuracy of parental esti-
Conclusion
mation of children’s weight produced conflicting results;
in
one series estimates were within 10% of the subjects’
In
conclusion the formula methods of estimating
actual weight ; where as in another study only 42% of
9
weights and heights for the various ages in children are
weight were accurate .
10
under- estimating their actual values. This is more obvi-
Similarly, “guessitimation” of children’s weight gives
ous
for height.
inaccurate results .
2
We
have been using these formulae in our local practice
The
under-estimation of weight and height using current
without finding out the actual statistical relationship.
formula methods will result in significant under - dosing
The current trend as found in this study calls for further
of
some emergency drugs, as has been reported in a
studies preferably multi-centred with larger cohort of
similar study by Luscombe and colleagues .
11
children to test the various formulae.
Some of the drugs used in emergencies like phenytoin
Authors’ contributions
employed in treatment of status epilepticns and opioids
used for analgesia should be based on total body weight
Ibe BC: Conceptualization of the study/ critical editing
in
obese patients because of distribution in fat mass .
12
of
the final draft
Considering the fact that under-nutrition is prevalent in
Eke CB: Data collection/ data analysis and study write-
Nigeria especially among under -five children
13,14
it
up
would have been expected that the formula methods
Ubesie AC: Data analysis, and manuscript writing
would over- estimate the weight and heights of our chil-
Conflict of interest: None
dren. These formulae as applied in the current study
Funding: None
References
1.
Black E, Barnett P, Wolfe R,
4.
Kliegman RM, Jenson HB, Behr-
7.
Seddon C, Lockitt L, Dhanjal S,
Young S. Are methods to estimate
man
RE, Stanton BF (editors).
Eseahut M, ISRN Pediatrics, 2012.
weights in children accurate?
Saunders Elsevier, Philadelphia,
Article ID: 869634, 4 pages. Avail-
Emerg Med (Fremantle) 2002; 14
USA; 2007; 70-74.
able @: http://
(2): 160 – 165.
5.
Oyedeji GA. Socio- economic and
dx.doi.org/10.5402/2012/869634.
Accessed: November 8 , 2013.
th
2.
Argall JAW, Wright N, Mackway
cultural background of hospital-
–
Jones K, Jackson R. A compari-
ized
children in Ilesha. Niger
J
8.
Hofer CK, Ganter M, Tucci M, et
son
of two commonly used meth-
Paediatr 1987;12: 111-117.
al.
How reliable is length - based
ods
of weight estimation. Arch
Dis
6.
SOWC 2008 statistical tables. The
determination of body weight and
child 2003; 88: 789 – 790.
State of the World’s Children
tracheal tube size in the paediatric
3.
Keane V. Assessment of growth.
2008. Available @:
age
group? The Broselew tape
In:
Nelson textbook of pediatrics,
www.unicef.org/sowc08/docs/
reconsidered. Brit
J Anaesth
18
edition.
th
sowc08.pdf.pp118- 120. Accessed
2002;88:283- 285.
15
January, 2009.
th

311
9.
Anglemyer BL, Hernandez C,
12.
Luscombe M, Owens B. Weight
15.
Ndukwu CI, Egbuonu I,
Brice JH, Zou B. The accuracy of
estimation in resuscilution: is the
Ulasi TO, Ebenebe JC. Determi-
visual estimation of body weight in
current formula still valid.
Arch
nants of undernutrition among
the
emergency department. Am
J
Dis child 2007; 92 (5); 412 – 415
.
primary school children residing in
Emerg Med 2004; 22 (7): 526 –
13.
Cheymol G. Effects of obesity on
slum areas of a Nigerian City.
529.
pharmacokinetics: implications of
Niger J Clin Pract 2013; 16:178-
10. Leffler
S, Hayes
M. Analysis
of
drug therapy. Clinical pharmacoki-
183.
potential estimates of children’s
netics 2000; 39 (2): 215 – 231.
16.
Martorell R, Khan LK, Hughes
weights in the ED. Ann
Emerg
14.
Sebanjo IO, Olayiwola IO,
ML,
Grummer – Strawn LM. Obe-
Med
1997; 30 (2); 167 – 170.
Afolabi WA, Sebanjo OC. Mater-
sity in women from developing
11.
Harris N, Patterson J, Norse J.
nal
and child undernutrition in
countries. Eur
J. Clin
Nutr 2000;
Doctors, nurses and parents are
rural and urban communities of
54: 247 – 252.
equally poor at estimating paediat-
Lagos State, Nigeria: the relation-
ric
weights. Pediatric
Emerg Care
ship and risk factors. BMC Re-
1999; 15 (1): 17-18.
search Notes 2013, 6:286.